Related Sections:
1.Feature Overview
2.How to Use
Feature Overview
This feature provides real-time sales data analysis based on the order placement time. You can view daily, weekly, monthly, and even hourly sales performance, covering key metrics such as sales revenue, cost, and profit. It is designed to help Amazon sellers analyze store and product-level performance in their day-to-day operations.
The system automatically syncs order data and platform fees (including commissions, FBA fees, advertising fees, etc.) via Amazon SP-API to ensure data accuracy and timeliness. For unsettled Amazon orders, our proprietary smart estimation engine analyzes delayed transaction data and historical sales to provide near-accurate real-time profit calculations—empowering you to monitor short-term business performance with confidence.
Additionally, users can manually input product procurement costs and initial shipping fees in the Cost Center, which the system will integrate into the overall cost structure for a more comprehensive profit analysis. With multi-dimensional insights, you can identify high-potential products, optimize product selection strategies, fine-tune pricing, and build store best-sellers.
Data is refreshed automatically every 10 minutes, keeping you up to date with the latest business dynamics.
For reports based on Amazon settlement times, please refer to the Financial Analytics.
How to Use
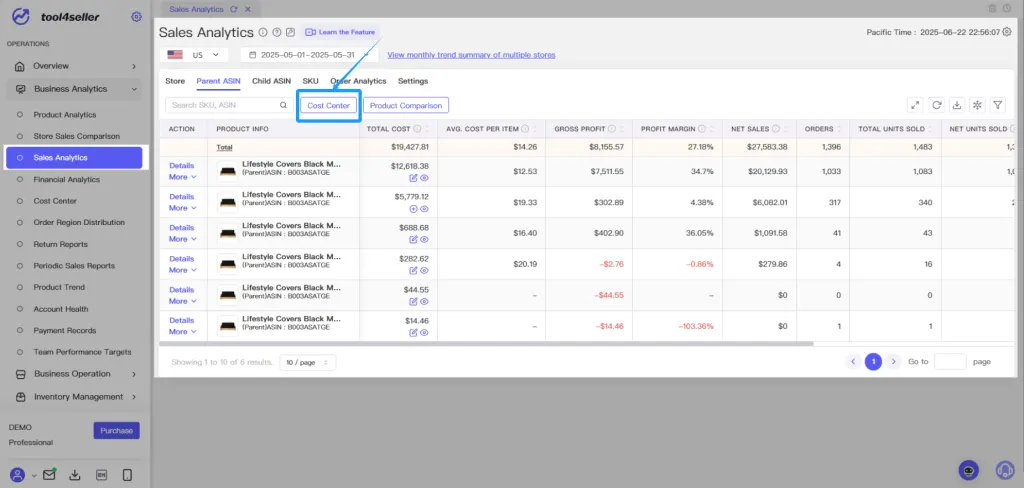
1. Navigate to Store Analysis and click on Sales Profit Analysis to access your store's key sales data. If this is your first time using this feature, we recommend going to the Cost Center to configure your product cost data in advance.
2. Core Metrics Explained:
① Orders: Total number of orders during the selected time period (excluding canceled orders).
② Total Units Sold: Total units sold, not deducting returns.
③ Net Units Sold: Total units sold minus returned items.
Net Units Sold = Total Units Sold - Returns
④ Sales: Sales before refunds, subject to sync frequency. Closely matches the "Sales Snapshot" in Amazon’s Business Reports.
⑤ Net Sales: Gross Sales minus refunds (based on refund occurrence date).
Net Sales = Sales - Refunds
⑥ Return Qty: Quantity of returns during the selected time frame.
⑦ Refunds: Total refunded value during the period.
Refunds = Return Qty × Unit Price
⑧ Return Rate: Includes pre-shipment cancellations, returns with or without physical item return. High return rates may indicate issues with service, product quality, or pricing.
Return Rate = Return Qty / Total Units Sold.
⑨ Total Cost: Includes product cost, logistics, Amazon fees (commission, FBA shipping), ad spend, promotions, etc.
⑩ Gross Profit:
Gross Profit = Net Sales - Total Cost or Gross Profit = Sales - Total Cost
⑪ Profit Margin:
Profit Margin = Gross Profit / Net Sales or Profit Margin = Gross Profit / Total Sales
⑫ ROI (Return on Investment):Includes procurement, shipping, FBA, commissions, ads, tax, storage, labor, custom costs, and other expenses.
ROI = (Profit / Cost Investment) × 100%
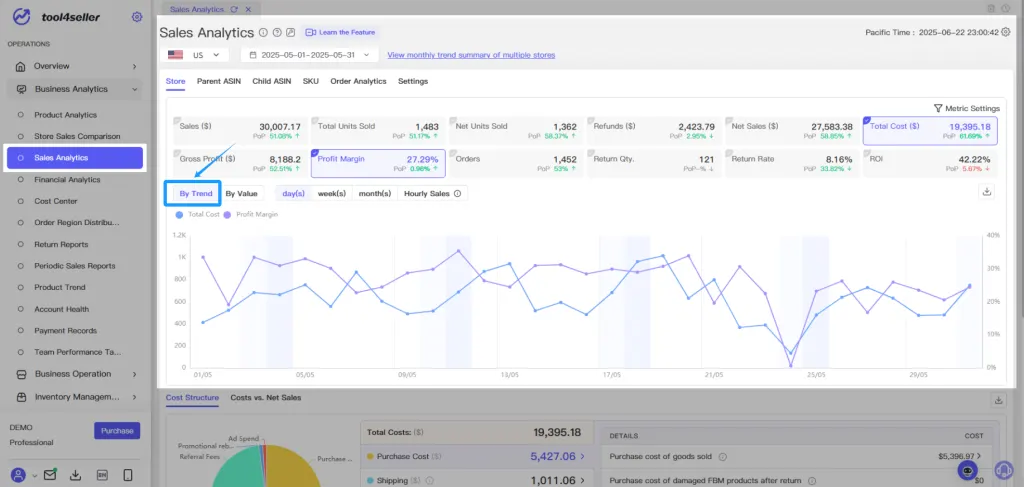
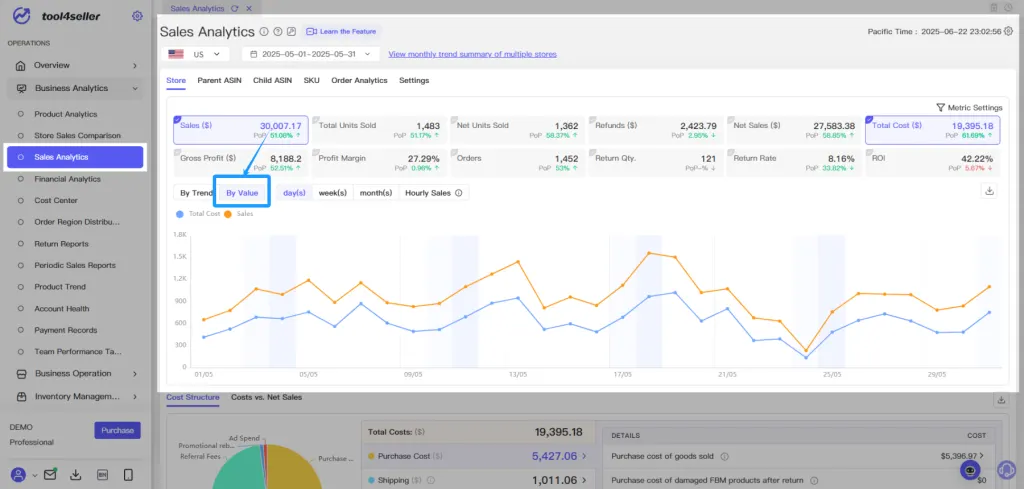
3. You can view metrics by day, week, or month using two different visualization modes:
(1) Trend Mode: Each metric has its own Y-axis—ideal for comparing metrics with large differences in scale (e.g., Total Cost vs. Gross Margin), and better at showing correlation in trends.
(2) Value Mode: All metrics share the same Y-axis—ideal for comparing metrics with similar scale or direct relationships (e.g., Sales vs. Total Cost).
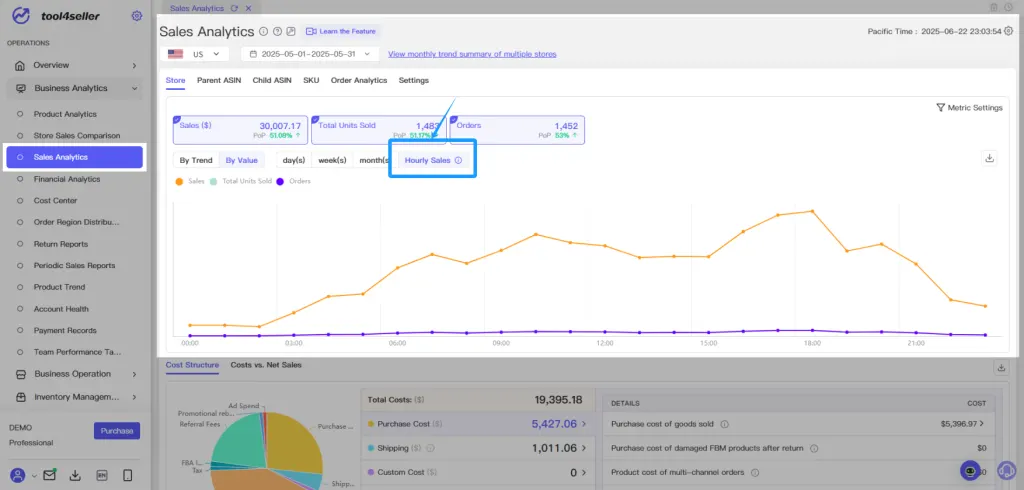
4. Use the Hourly Sales feature to view time-segmented overlays for key metrics such as Sales, total Units Sold, and Orders.
For example: Selecting May 1–31 and viewing sales in “Hourly Sales” mode will show the sum of sales for the same time slot across all days in the period, helping you identify sales peak hours per site or product.
This is useful for setting ad scheduling, budget adjustments, or automated pricing based on time segments.
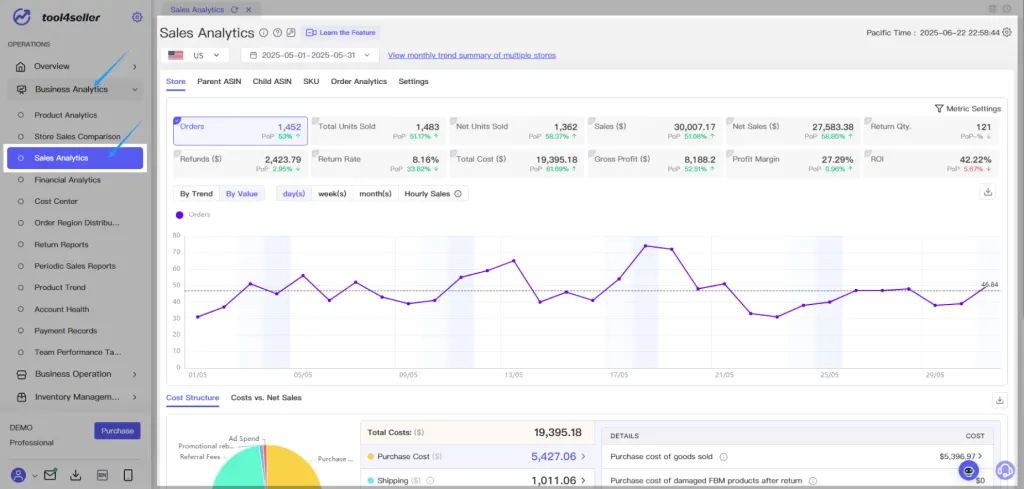
5. The Cost Breakdown Chart visually displays the proportion of different cost categories, helping you identify opportunities for cost optimization.
The pie chart reflects cost proportions relative to total cost, not sales.
You can explore subcategories within each main cost type.
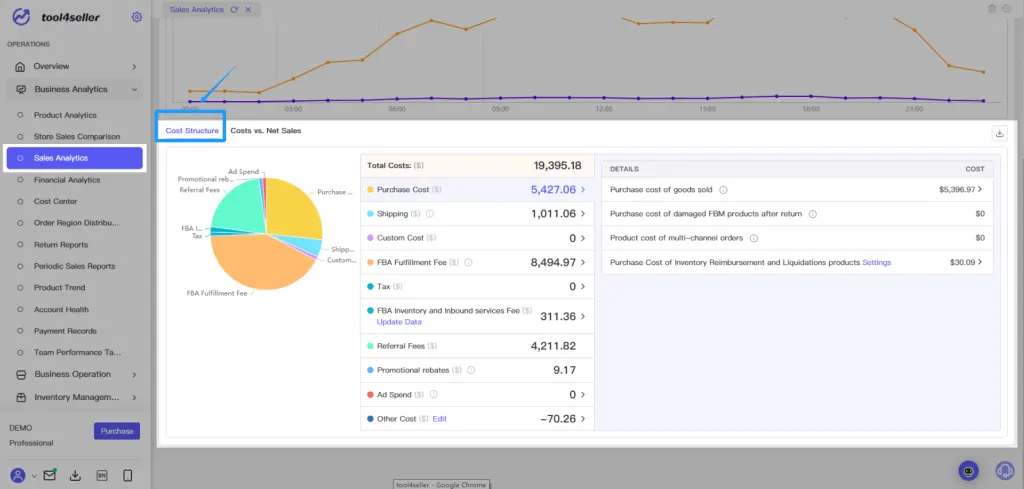
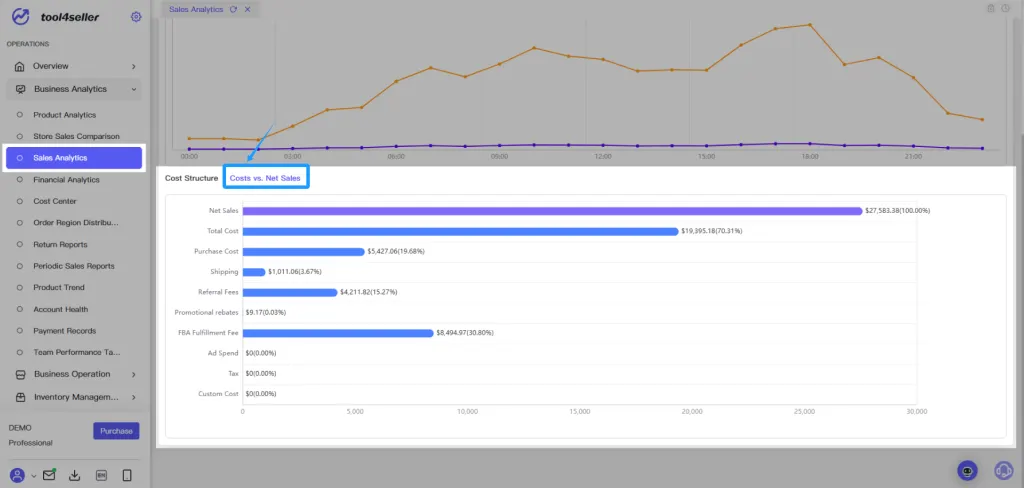
If you want to validate the ratio of costs to sales (e.g., whether commission is around 15%), use the Cost vs. Net Sales tab on the right.
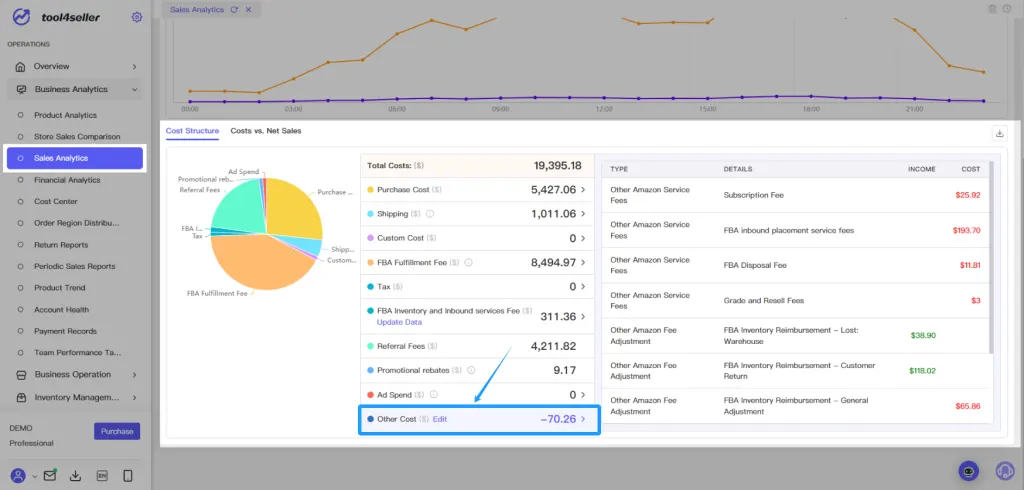
Other Costs include Amazon Subscription Fee, FBA Disposal Fee, FBA Inventory Reimbursement, and other miscellaneous charges.
Note: Some costs cannot be attributed to individual ASINs. Use the store-level “Other Costs” as the reference point.
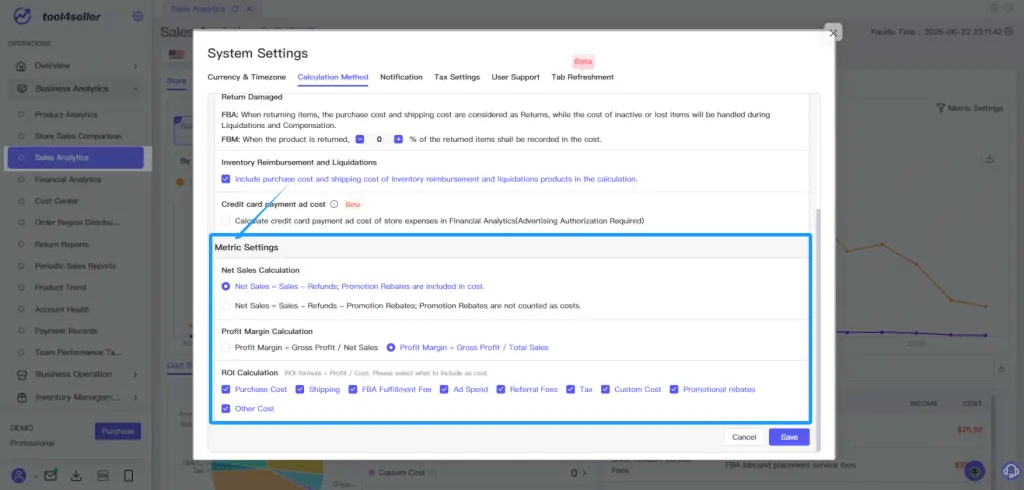
6. Click Settings in the top-right to customize the calculation methods for:
①Net Sales
②Gross Margin
③ROI Cost Components (select which costs to include)
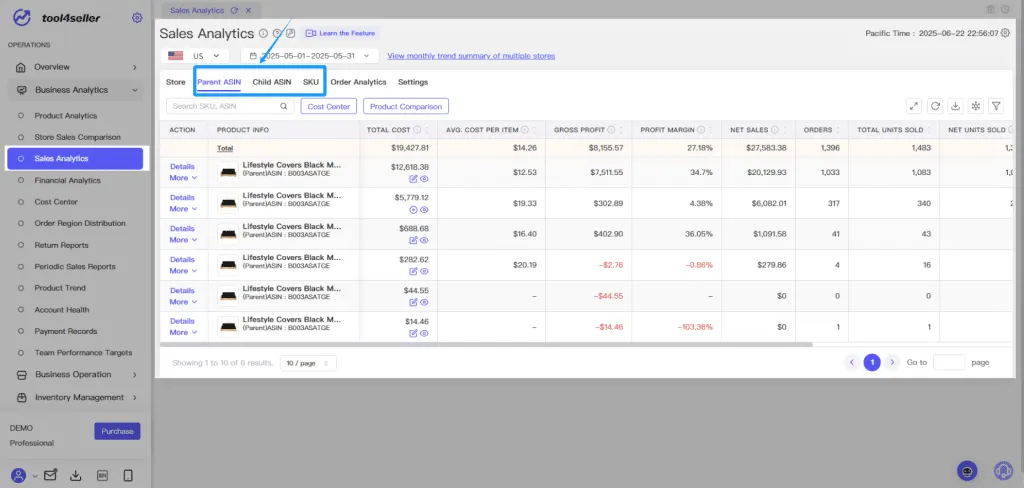
7. You can also drill down into parent ASIN, child ASIN, and SKU-level sales performance.
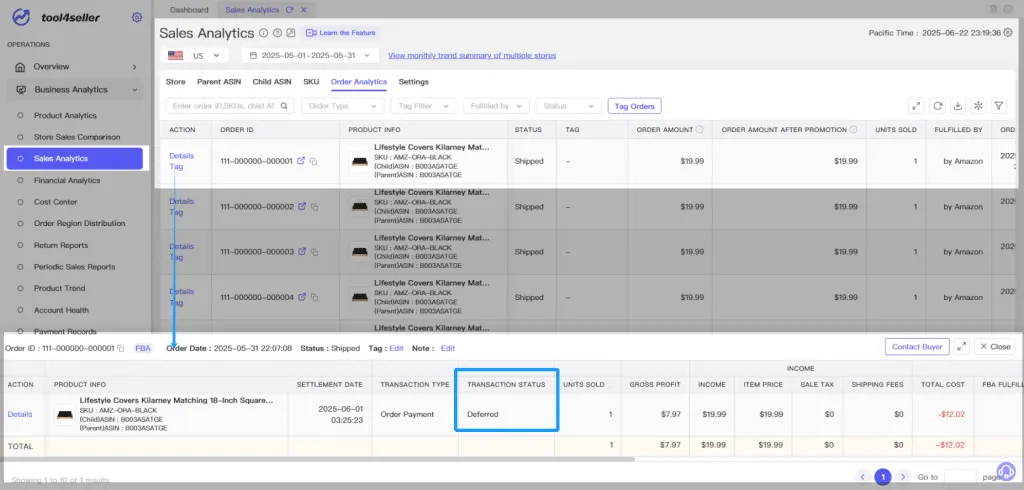
8. Click Orders to view all order details within the selected time frame.
The system integrates Amazon delayed order data and uses our proprietary estimation algorithm to calculate sales, costs, and profit for unsettled orders.
9. Go to the Cost Center to input and manage various cost components, improving the accuracy of your profit calculations.
Refer to the Cost Center documentation for details.