


On the "Product Analytics" page, you can view the sales, cost, and advertising performance of the products from 3 perspectives — Parent ASIN/ Child ASIN and SKU. Product Analytics can help you analyze whether the products are profitable and popular. It’s one of the effective ways to evaluate whether a new product is good or not.
1. How to make use of "Product Analytics"?
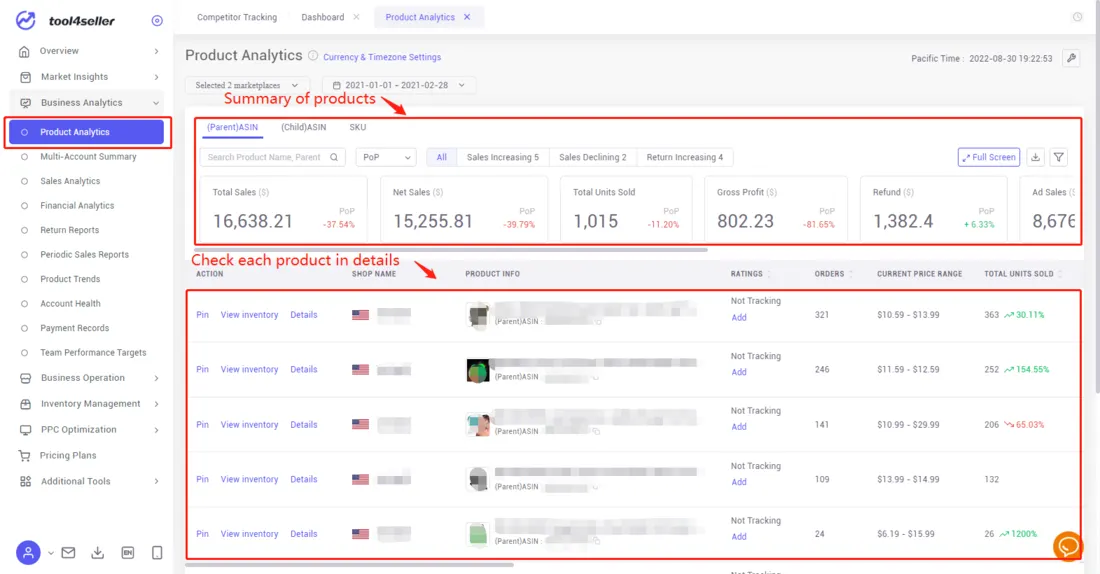
Product Analytics has 2 parts:
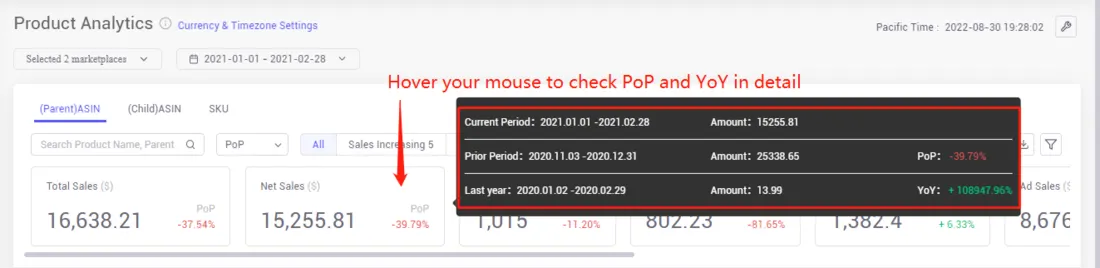
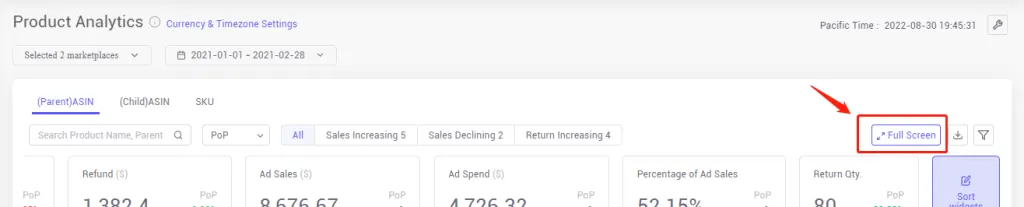
(1) Part1: One is the summary part for you to understand the total sales and other metrics of all products at once. Hover your mouse to the metric block to check the PoP (period over period) and YoY (year over year) in detail.
1) PoP: the difference of data compared with the same last period.
E.g. Current period is Aug. 01 - Aug. 20, 2022 (20 days), and its PoP will be compared with the data from Jul. 11 ~ Jul. 31, 2022 (20 days).
2) YoY: the difference of data compared with the same period in the last year.
E.g. Current period is Aug. 01 - Aug. 20, 2022 (20 days), and its PoP will be compared with the data from Aug. 10 ~ Aug. 20, 2021 (20 days).
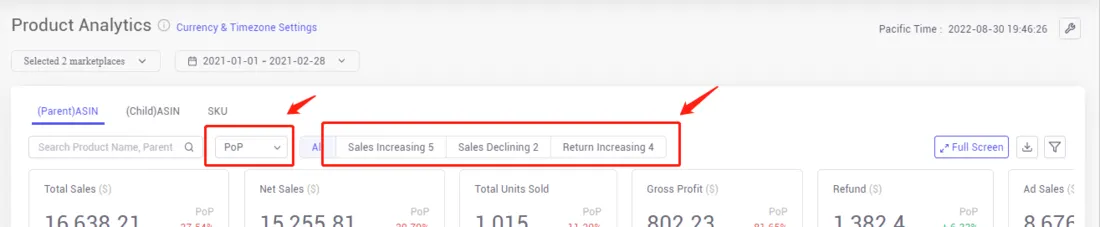
Besides, there is 3 indicators tab for you to quickly know which product is in the sales increasing/ declining or return increasing.
1) Sales Increasing: The number of refunds increased by 30% compared to the previous period.
2) Sales Declining: The number of refunds increased by 30% compared to the previous period.
3) Return Increasing: The return quantity increased by 30% compared to the previous period.
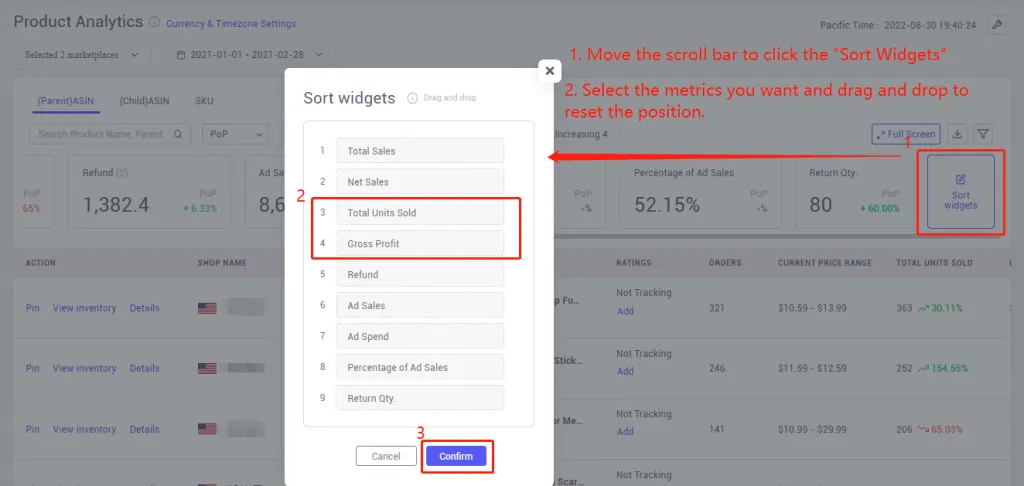
And move the scroll bar to reset the order of metric blocks.
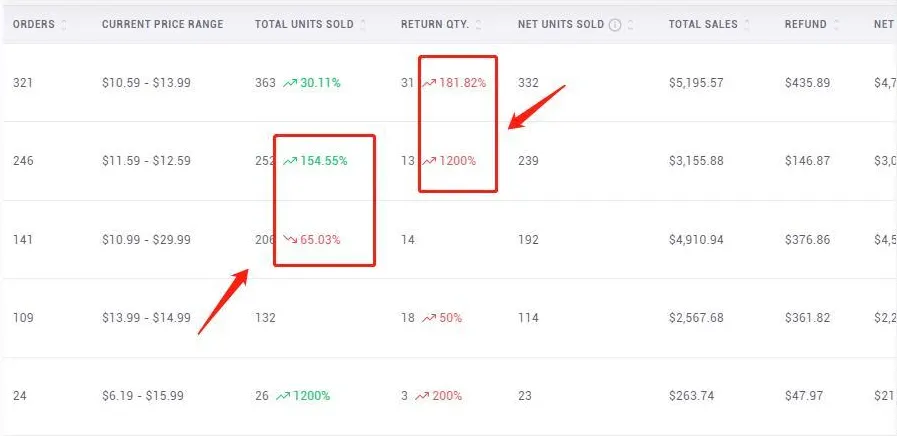
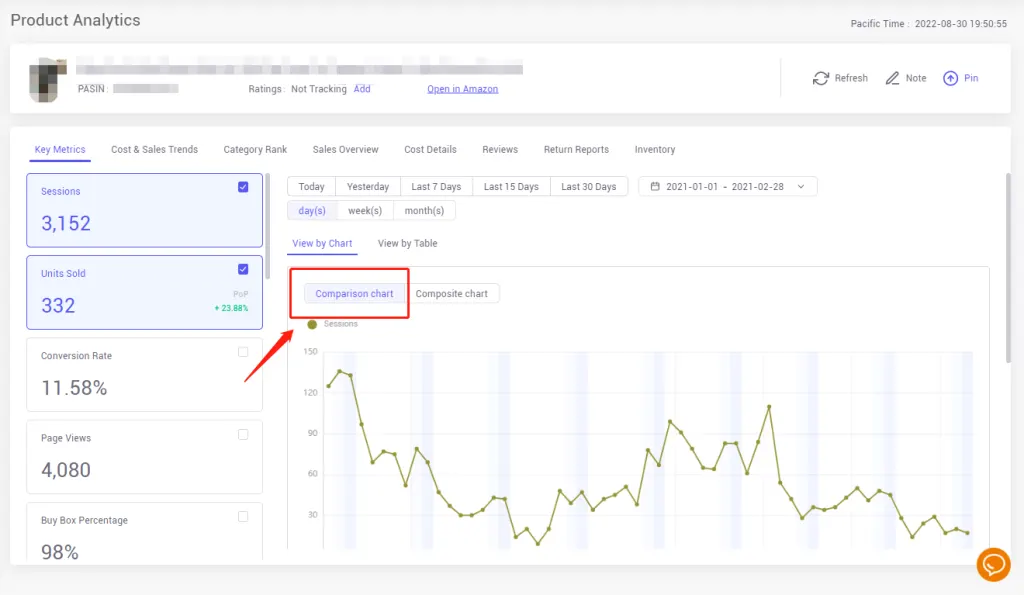
(2) Part2: The other part is where you can check various key metrics of the product.
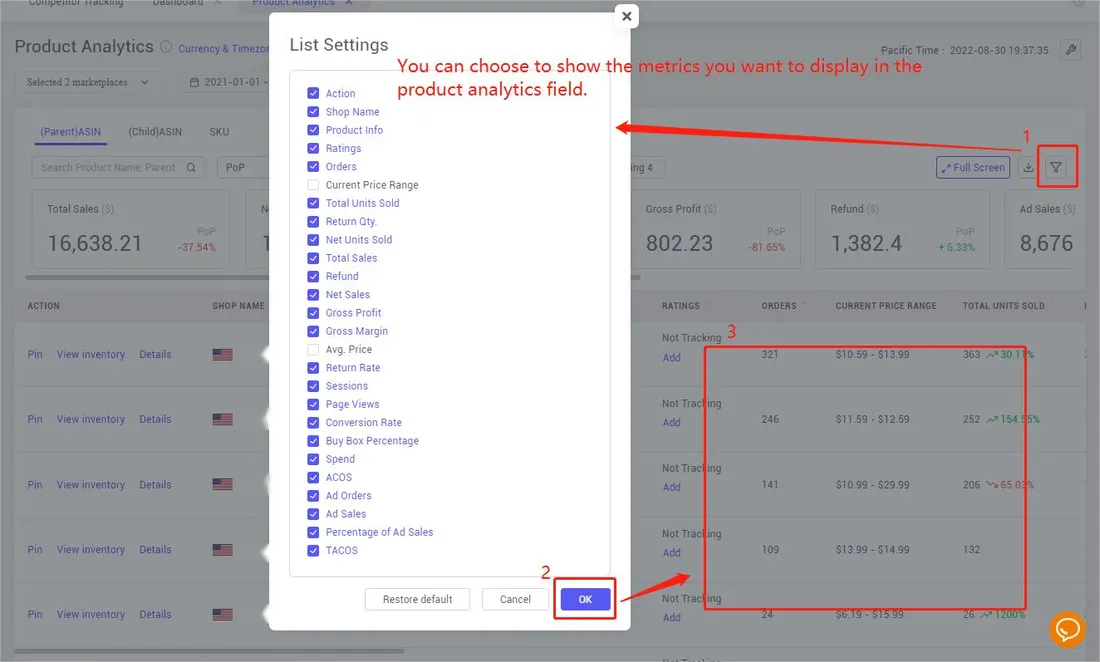
The green number means increasing and the red one means declining. Kindly remind you if the green increasing return numbers show then you need to check the review and see how to fix the aftersales problem.
Click the "Full Screen" button to view data on full screen.
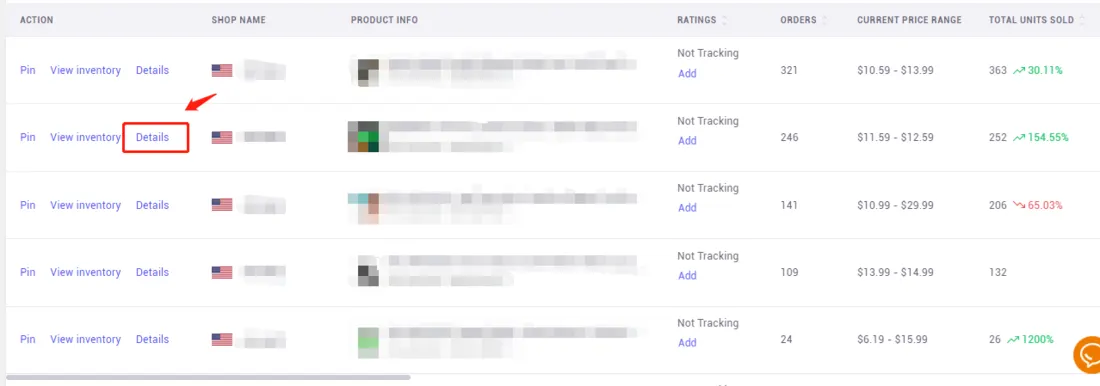
2. How to view detailed sales analytics and graph of products one by one?
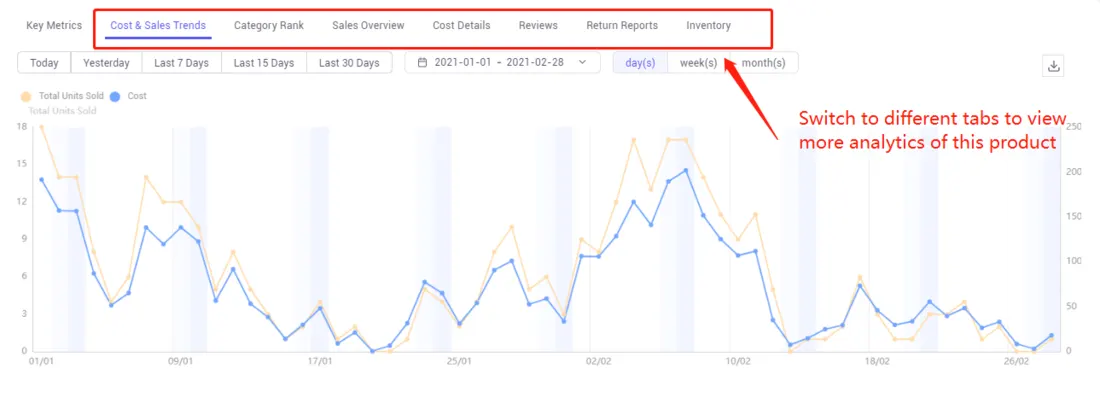
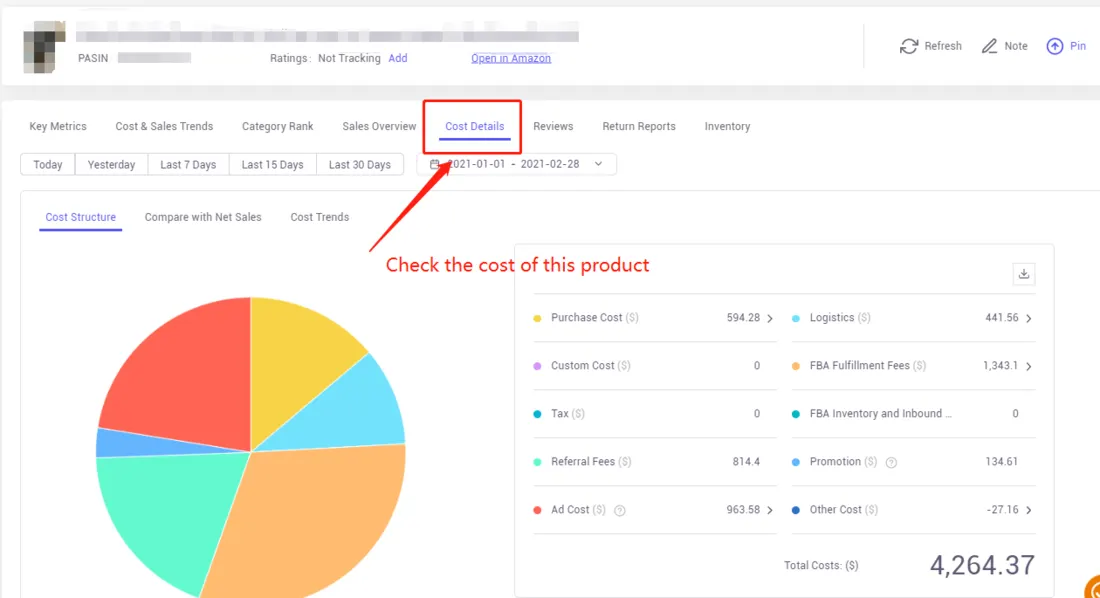
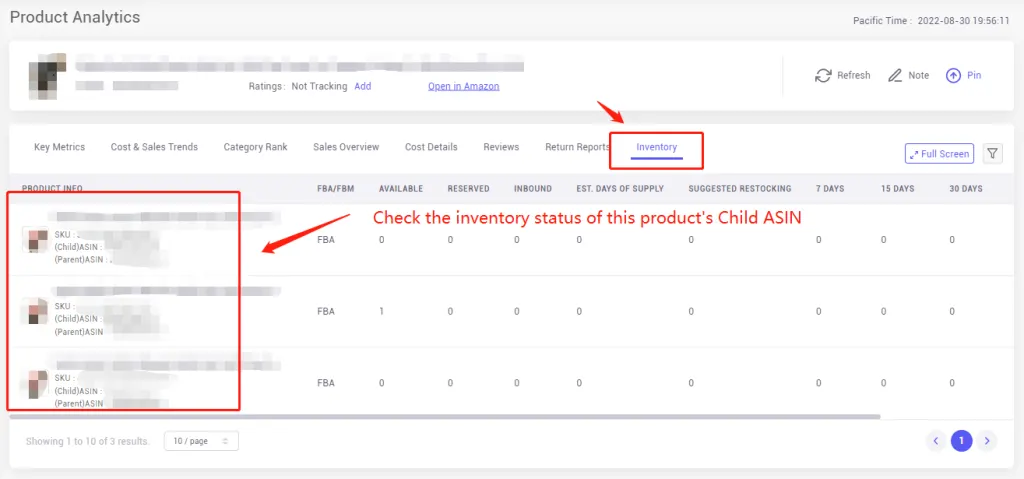
Click the "Details" button to check more info about the product and view all kinds of graphs and charts which include Key Metrics, Cost& Sales Trends, Category Rank, Sales Overview, Cost Breakdown, Reviews, Return Reports, and Inventory Status.
Switch to different tabs to view more analytics of one product.
Select metrics on the left bar to see more charts.
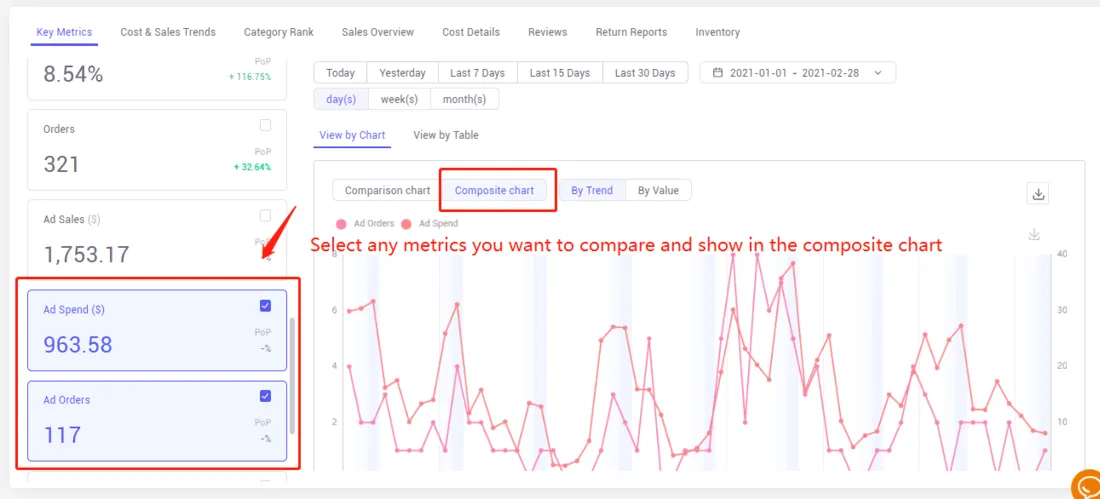
Or you can select multiple metrics and compare them at one time by using a "Composite chart".
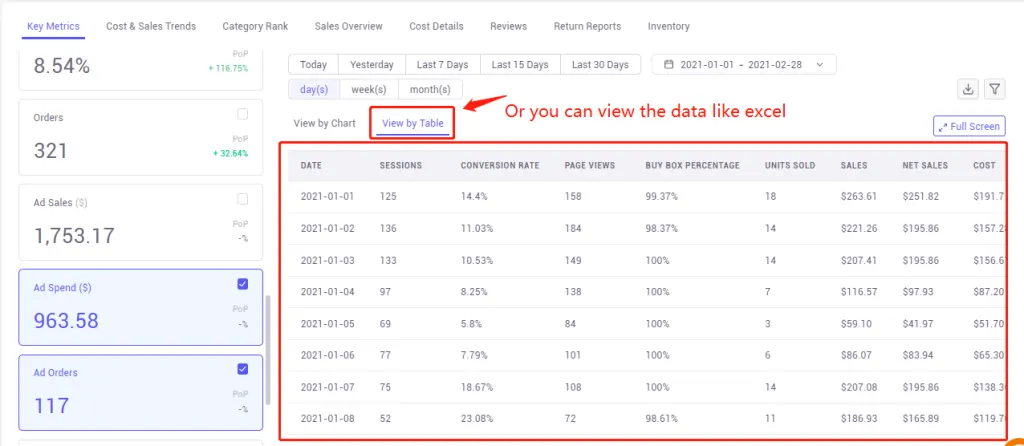
It also supports you to view the graph and chart as sheets.
The cost breakdown chart will clearly let you know the cost of selling this product and how you can narrow it down.
In the Inventory tab, you can see the current inventory status at the SKU level.
More questions, welcome to contact us at support@tool4seller.com.