
Every Amazon seller knows the feeling. You're spending more on ads, constantly tweaking keywords, and yet sales growth feels like a shot in the dark. We pour money into PPC campaigns hoping we've chosen the right search terms, but we often lack the definitive Amazon search query performance data to know what's truly working.
Deep within Amazon's Brand Analytics lies a goldmine of first-party data that holds the answers: the Search Query Performance (SQP) report. This isn't a third-party estimate; it's the official, unfiltered truth about how real customers find and purchase products. The challenge, however, is that this raw data can be overwhelming—a wall of numbers that's difficult to translate into action.
As both sellers and developers, we knew there had to be a better way to harness this power.
Understanding the Search Funnel with Official Amazon Data
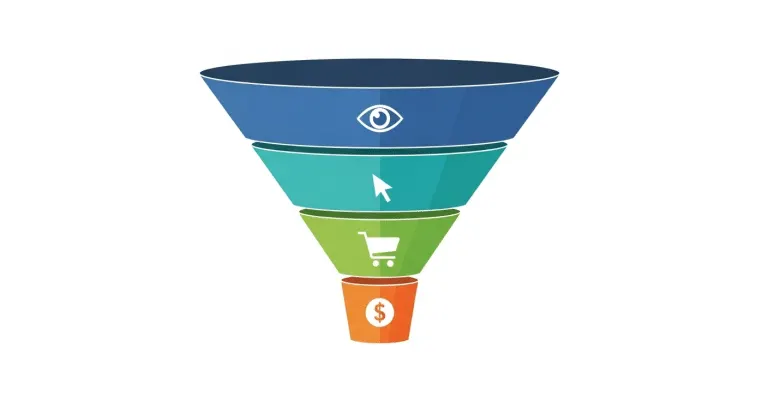
Before diving into the solution, it's crucial to understand why this data is a game-changer. The SQP report maps the entire customer journey on Amazon, from the moment a shopper types a query to the final purchase. It gives you concrete numbers for the entire search funnel: Impressions, Clicks, Add to Carts, and Purchases. This allows you to pinpoint exactly where you might be losing potential customers and, more importantly, why.
How to Analyze the Search Query Performance Report Efficiently
Our goal was to make this analysis intuitive. Here’s how our Search Query Performance feature in tool4seller transforms this complex process into a simple, strategic workflow.
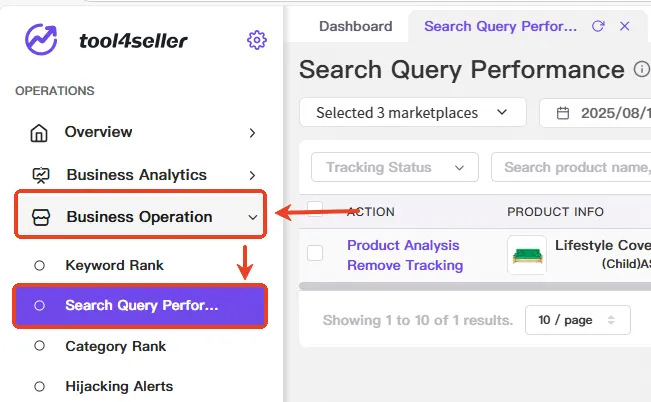
It begins with telling the system which products to monitor. You simply navigate to the 'Search Query Performance' tab under the "Business Operations" module and add the ASINs you want to track. The system then automatically pulls and visualizes the last four weeks of data, saving you the hassle of manual downloads and spreadsheet management.
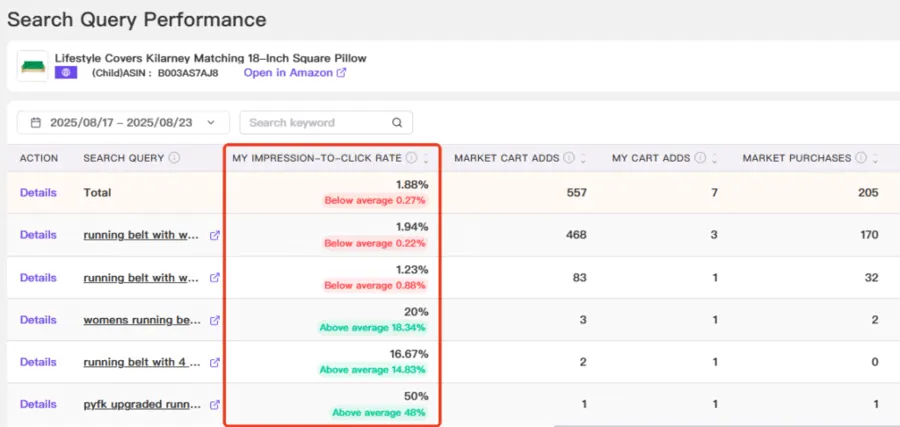
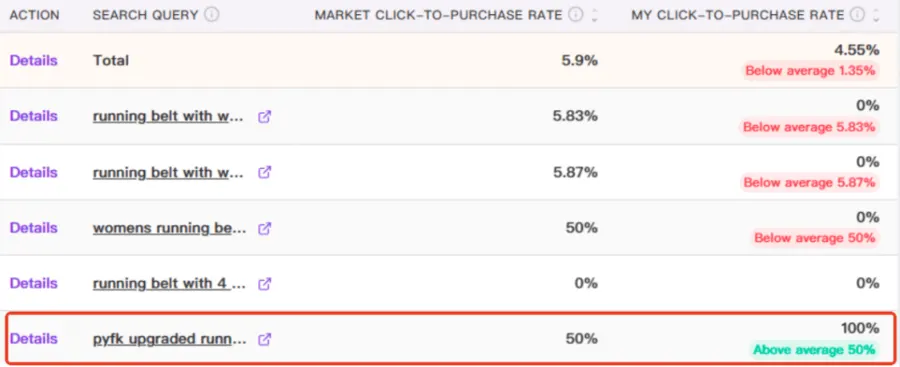
Once a product is tracked, you can click "View Data" to see its performance across every relevant search term. This is where the real magic happens. Instead of just seeing your click-through rate (CTR) or conversion rate, you see how it stacks up against the market average for that specific search term. We use simple green and red tags to instantly show if you're outperforming or underperforming the market, helping you diagnose your search funnel at a glance.
Case Study: Using SQP Metrics to Boost Conversion Rates
Let's walk through a common scenario with a fanny pack product to see how this works in practice.
While analyzing our data, we noticed the search term “womens running belt with water bottle waist” had a very high CTR (marked green), but a disappointingly low purchase rate (marked red). This told us a critical story: our main image and title were compelling enough to earn the click, but the product itself wasn't what these specific shoppers were looking for. The immediate action is clear: add this term to our negative keywords in PPC to stop wasting ad spend on irrelevant clicks.
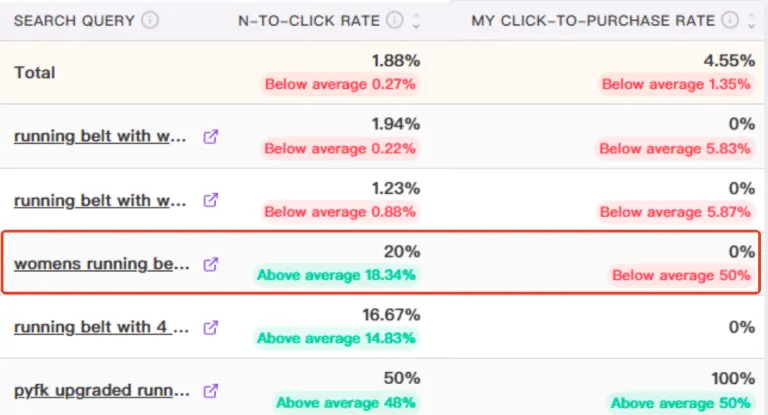
On the other hand, we found the search term “pyfk upgraded running belt with water bottles” had an incredible purchase rate, well above the market average. This is the kind of insight that drives growth. It confirms that when shoppers used this exact term, they were ready to buy our product. This isn't just a good keyword; it's a core business driver. The strategy here is to double down—increase the ad budget and bids for this term and ensure it’s prominently featured in our listing's title and copy to boost our organic rank.
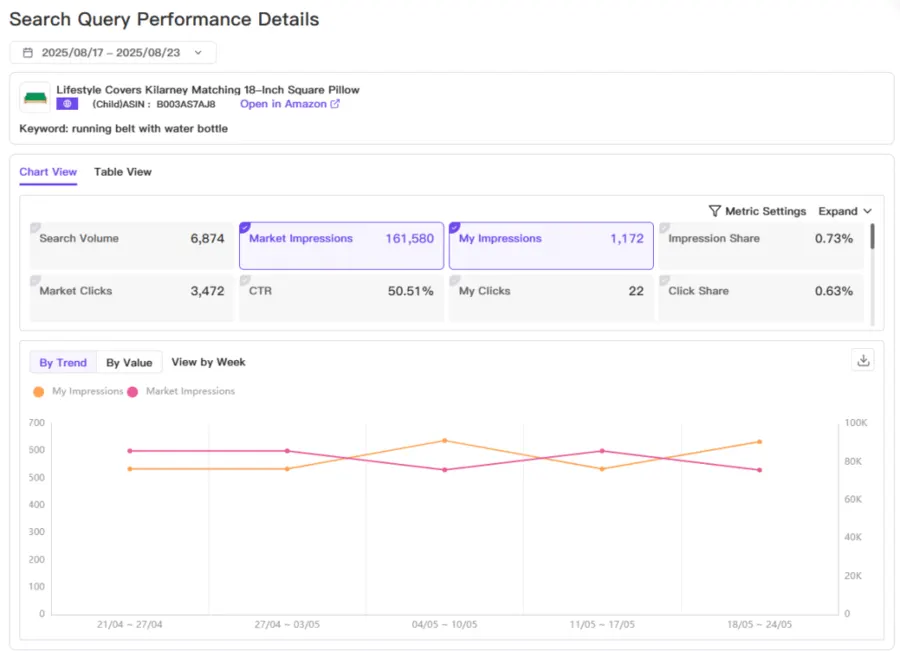
For these crucial terms, you can even click the "Details" button to view performance trends over time. This helps you understand if a keyword's performance is a one-time spike or a sustained trend, allowing you to make smarter long-term strategic adjustments.
It’s about transforming raw data into a clear strategy for PPC and listing optimization. By understanding exactly how customers find you and where they drop off, you can make targeted, effective decisions that impact your bottom line. Don't let this valuable official Amazon data sit untouched. It’s time to leverage these search analytics to connect every insight to a real, impactful action. Explore the Search Query Performance feature in tool4seller to start making truly data-driven decisions today.